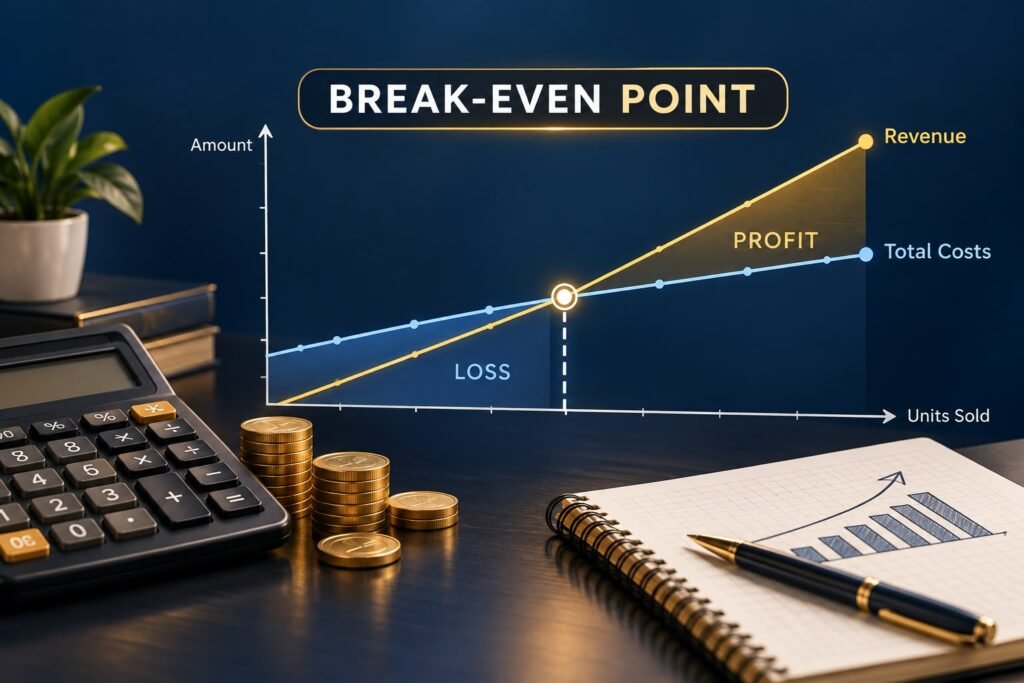
Every small business needs to cover its costs before it can earn a profit. The question is how much you have to sell to get there. Break even analysis for small business answers that question with a simple calculation, and it turns a vague hope of “making enough” into a specific sales target.
This guide explains what a break-even point is, how fixed and variable costs affect it, and how to calculate it in units and in dollars. It also includes a worked example and practical ways to lower your break-even point.
What Is Break-Even Analysis for small business?
Break-even analysis is a method for finding the level of sales at which your total revenue equals your total costs. At that point, your business is not losing money and not making a profit. Every sale beyond it adds to profit.
The result is called the break-even point. You can express it as a number of units sold, such as 167 products or 60 service hours, or as a dollar amount of sales.
Why Break-Even Analysis Matters
Knowing your break-even point helps with several everyday decisions:
- Pricing: You can see how a price change affects the sales you need.
- Sales targets: You get a minimum goal based on your actual costs instead of a guess.
- New expenses: Before signing a lease or hiring, you can check how much extra revenue the cost requires.
- Planning: It shows how much room you have if sales dip.
It is a planning tool, not a profit forecast. It tells you where the floor is.
Fixed Costs vs. Variable Costs
The calculation depends on sorting your costs into groups. If your records are organized, this is much easier. See our guide to small business bookkeeping for how to keep costs categorized, and our article on small business expenses for how to track them.
Fixed Costs
Fixed costs stay about the same no matter how much you sell in a given period. Common examples include rent, employee salaries, and insurance.
Variable Costs
Variable costs rise and fall with sales volume. Examples include materials, packaging, sales commissions, and shipping or distribution costs.
Mixed Costs
Some costs contain both a fixed and a variable part. Where possible, separate these into their fixed and variable parts so your calculation is as accurate as it can be.
Break-Even Formulas
You need two numbers first: your total fixed costs for a period (usually a month) and your variable cost per unit. The SBA also publishes a SBA break-even point calculator that uses the same approach.
Contribution Margin per Unit
The contribution margin is the part of each sale left after variable costs:
Contribution margin per unit = Selling price per unit − Variable cost per unit
Break-Even Point in Units
Break-even units = Fixed costs ÷ Contribution margin per unit
Break-Even Point in Dollars
Break-even sales = Fixed costs ÷ Contribution margin ratio
The contribution margin ratio is the contribution margin per unit divided by the selling price.
Break-Even Analysis for small business:A simple Examaple
Suppose a small business sells a handmade product. These numbers are hypothetical.
- Monthly fixed costs: $4,000
- Selling price per unit: $40
- Variable cost per unit: $16
Step 1: Find the Contribution Margin per Unit
$40 − $16 = $24
Step 2: Find the Break-Even Point in Units
$4,000 ÷ $24 = 166.67, which rounds up to 167 units per month.
Step 3: Find the Contribution Margin Ratio
$24 ÷ $40 = 0.60, or 60%
Step 4: Find the Break-Even Point in Dollars
$4,000 ÷ 0.60 = $6,666.67, or roughly $6,667 in monthly sales.
Check the Result
167 units × $40 = $6,680 in sales. Variable costs are 167 × $16 = $2,672, and fixed costs are $4,000, for total costs of $6,672. Sales slightly exceed costs, so 167 units is the first whole-unit level that covers everything.
Break-Even Analysis for a Service Business
Service businesses can use the same formula with hours or projects as the “unit.”
Suppose a freelancer has these hypothetical numbers:
- Monthly fixed costs: $3,000
- Hourly rate: $60
- Variable cost per billable hour: $10
The contribution margin is $60 − $10 = $50 per hour. The break-even point is $3,000 ÷ $50 = 60 billable hours per month.
How to Calculate a Profit Target
You can adjust the formula to find the sales needed for a specific profit. Add the desired profit to fixed costs, then divide by the contribution margin.
Using the product example, to earn $2,000 in profit:
($4,000 + $2,000) ÷ $24 = 250 units
This turns a profit goal into a clear sales goal.
Margin of Safety
The margin of safety is the gap between your expected sales and your break-even sales. It shows how far sales could fall before you start losing money.
Margin of safety = (Expected sales − Break-even sales) ÷ Expected sales
If the business above expects to sell 220 units and breaks even at 167, the margin is (220 − 167) ÷ 220, which is about 24%. A larger margin means more cushion.
How to Lower Your Break-Even Point
A lower break-even point means you reach profit sooner. There are three levers.
Raise Your Price
If the product above sells for $44 instead of $40, the contribution margin becomes $28, and the break-even point drops to $4,000 ÷ $28, or about 143 units. Test this carefully, because a higher price may also affect demand.
Reduce Variable Costs
Negotiating with suppliers, changing materials, or cutting waste raises the contribution margin per unit.
Reduce Fixed Costs
If fixed costs fall from $4,000 to $3,500, the break-even point becomes $3,500 ÷ $24, or about 146 units.
Limits of Break-Even Analysis
The method is useful, but it relies on simplifying assumptions:
- It assumes a steady selling price and steady variable cost per unit, even though real prices and costs can change.
- It treats fixed costs as constant, but they can jump when you expand.
- With several products, you need an average margin or a separate calculation per product.
- It does not show timing. Break-even analysis does not show when money actually comes in and goes out. For that, see our guide to small business cash flow.
Common Break-Even Mistakes
- Misclassifying costs. Putting a variable cost in the fixed group, or the reverse, distorts the result.
- Leaving costs out. Forgetting insurance, fees, or owner-related costs makes the target too low.
- Using old numbers. Costs and prices change, so an old calculation can mislead.
- Ignoring demand. The formula shows what you must sell, not whether customers will buy that much.
When to Recalculate
Revisit your break-even point whenever prices, costs, or your product mix change, and before major decisions such as a new location or hire. Pair it with your small business budgeting process and your profit and loss statement to compare projected figures with actual results.
Frequently Asked Questions
What is a break-even point?
It is the level of sales where total revenue equals total costs, so the business has neither a profit nor a loss.
How do you calculate break-even for a small business?
Divide fixed costs by the contribution margin per unit to get break-even units. Divide fixed costs by the contribution margin ratio to get break-even sales in dollars.
What is the difference between fixed and variable costs?
Fixed costs stay roughly the same regardless of sales, such as rent. Variable costs change with sales volume, such as materials and shipping.
Can a service business use break-even analysis?
Yes. Use billable hours, projects, or clients as the unit, and apply the same formula.
How often should I recalculate my break-even point?
Recalculate when prices or costs change, and before major decisions. Reviewing it regularly keeps the number useful.
Does reaching break-even mean my business is healthy?
Not necessarily. Break-even shows that costs are covered on paper, but it does not show cash timing, taxes, or whether sales are steady.
Conclusion
Break even analysis for small business gives you a clear starting target. By separating fixed and variable costs, calculating the contribution margin, and applying the formula, you can see how much you need to sell to cover costs and how pricing and expenses move that number. Keep your inputs current, and use the result alongside your budget and financial statements to make steadier decisions.